Mr Flanagan: “Holy turnip soup. There’s that maybe all over again. I thought this was it. What in the beh gee bee whitterkers is it now?”
I thought that would get your attention! Tired of hearing all this heinous trajectory of errors and such, are we?
Mr Flanagan (mumbling): “Besides that and you could have written all this pizazz on one page.”
I heard that! I’m rambling – that’s what ramblers do, they ramble and sometimes rumble. Besides, if CMP can lay the rambling on their customers, then CMP should be able to take the customer rambling rumbles and translate that … wait for it … wait … wait … into work. That’s right, CMP management needs to just get out of that attitude.
And here we go…
Figure 8-1. Access your smart meter data here via this button once you log in. Also make sure you are enrolled in this service.
Introducing the CMP data download. If you have a smart meter, then you can download your usage data from the CMP website! And I use this.
When you download data, the application prompts for a date range of the data you would like to download – the first and last date of said date range. You are also given the option to chose either a Comma Separated Values output file or a Green Button XML output file. Good luck finding Green Button software, but since it is XML, one can still load it in a spreadsheet program such as MS Excel. I don’t bother. Everyone’s mileage may vary of course. To each his own. Etc.
Mr Flanagan: “I like the sound of XML. The other one might get confused with the pharmacy.”
Nice to know that some things confuse people – kinda like some of what we’ve covered.
Mr Flanagan: “You got me there, Mr P.”
So to help folks understand, here’s a screen shot of that “submittal” screen.
Let’s pick 9/23/2020 through 9/24/2020 and choose CVS, I mean CSV, for output format.
Figure 8-2. The “My Smart Data” download Submit screen. AKA Green Button.
Then click on the SUBMIT button.
Note that the screen does not allow one to select just one day, ie 9/23 through 9/23. It has to be at least a two day range, as shown above. I find this restriction rather annoying.
After a few moments, the output is generated and placed in the Downloads folder on one’s computer. Let’s take a look at what we’ve downloaded.
Figure 8-3. The “My Data Download” in CSV (Comma separated value) format. This file can be read by other programs for subsequent analysis for example. The hidden data here is account and meter info not relevant to this discussion.
Let’s explain this download file briefly.
The download file contents are summed to each hourly interval, and thus, resulting in 24 rows for each day. If 2 days are selected, then 48 rows should be in the downloaded file, which is the case here.
Each row is comprised of 6 attributes – account info values, meter identifier, date time, and usage values. For this example, we are only interested in the date time and Usage fields, so that is what we show, and the other fields are blurred intentionally as previously mentioned. And, date time is one field.
Now that we’re past that, let’s look at the actual data.
And, amazingly, already the first row in the download file is actually the value for the last hour of the previous day, ie 9/22, and should not be in the download. Remember that we only asked for 9/23 through 9/24.
Here is a snapshot of the last hour of the 22nd.
Figure 8-4. See that the 0.841 kWh value here is the same value in the first line of the output file above? If not, trust me, and I know it is rounded down to two decimal places on this graph.
So consequently, that leaves 47 rows remaining to analyze, not 48. Guess what was left out?
Mr Flanagan: “Holy grappling hook roof destruction batman. Even I can see that the last hour of the 24th is missing.”
Oh, how’s that.
Mr Flanagan: “I read ahead. I mean it’s obvious.”
If it’s obvious, how come no one fixed it.
Mr Flanagan: “Probably the software vendor or the cloudy analytics service.”
Yeah, who knows – we could go on forever pointing at the sky. The customers don’t care. They only care that the data is what they asked for – nothing more, nothing less.
So yes, Mr F, the data for the last hour of the 24th is missing as highlighted below, along with other details.
Figure 8-5. The Usage download file. The file has been slightly modified to blur account information, and to also provide extra blanks for easier reading. Oops, part of my last comment “in red” is missing. It should read “…of the last hour of 9/24. To get this last hour for the 24th, one must download data for the 25th.” What nonsense, this part of the download should be fixed ASAP.
And, some sharp blurry eyed folks might have noticed from a previous episode that I showed the daily usage graph for 9/23. It was in fact a “flat liner” graph with every hour having a value of 0.79 kWh. Well, those same folks are seeing the “real” data for 9/23 in rows 2 through 25 of the download data, and the hourly usage values surely aren’t all 0.79! Score 1 for My Downloaded Data.
So apparently, in some cases, incorrect data is shown on the Energy Manager detail even though the correct data is available from a CMP system somewhere because I can download it. You can put data over there, you can put data over here, hey guys you wanna put data everywhere?
I think this is it. No more illusions.
Let me summarily summarize something and call it good.
The Absolute Mighty Big Small Ending
The customers only care that the information contained in Usage Alerts, Energy Manager, Usage Downloaded data, and that other thing called BILLING statements is 100% accurate.
At least that’s what I think they think.
And I’m about .000157232 percent of the CMP customer base.
If all of CMP customers combined were 10 Mount Katahdins high (the land mass in Baxter State Park, not the Oxen mammoth), and being of equal height, then we’d each be about 1 inch tall. That’s pretty small, and that’s what being a customer is not supposed to feel like.
The end.
Mr Flanagan: “Not sure if I get it – That Katahdin thing.”
I’ll take CMP Data Integrity Problems for $200 Alex…
Mr Flanagan: “I Object, your Immenseness!”
PUCness: “Overruled, without prunes and prejudice, please refrain from leading the customers into misleading things.”
Well, alrighty then, or then not, depending on how you look at it through the looking glass. Mr F, see me after dismissal.
The author, that’s me, discovered several years ago that using Central Maine Power’s Usage Alerts and the Energy Manager system were both problematic. Using CMP’s Contact Us web form was useless as my communications with this method resulted in no replies from CMP, notwithstanding that one needed to copy the information submitted as no copy is made available once submitted, ie no capability to “send/copy” to my own e-mail. A “reference” number of some kind would have been at least something. But alas, nothing.
So I installed my own “smart meter” system and I get meter readings pumped right to my own computer network right in the comfort of my own home. How nerdy is that? And I also use the “Another Way” to be discussed in Part 8.
Therefore, let us take note of the other parties… (note that I have actually had NO contact with these folks, just search engines).
Discovery Party #1
In a letterto the centralmaine.com editor in August 2019, a CMP customer wonders “how many people use Central Maine Power’s Energy Manager on their website and use it correctly.” Well CMP? How many customers? And, after reading all this how can one use it correctly at all? Ya know, problems and all.
The title of the letter piece is “CMP’s problems go beyond billing”. Bearing resemblance to my original title I decided to change mine, not that anyone will read this.
Continuing…
Said customer continues on with a mention that Energy Manager is perused often “especially when running the air conditioning so much.” While doing so, issues have been found. For example, they found that some days were a “straight line all the way across”. The Days graph has aggregated usage at hourly intervals, and is simply not going to be a straight line for normal customers during a normal day. So it has to be abnormal – Abby Normal. And a second observation was that the graph was displaying some unknown usage values even though there was no usage, ie should be 0 due to power outage. I cover these in Part 6. For the sake of coolness, here is a relatively recent day with this “straight line” problem from my very own CMP account on Energy Manager.
Figure 7-1. This is a straight line, or flat liner, problem from my CMP Energy Manager account for 9/23. This correlates to the Discovery Party #1’s observation, and mine to theirs, vice versa, and hence forth.
So there are issues across multiple customers. Look’s like it isn’t just me! Right CMP? Explanation?
Oh, and here is a non-straight line version of what really happened that day for me.
Figure 7-2. What my own home computer captured for 9/23. And yes, I can zoom in for more detail – up to one minute granularity. Look, it is not a straight line!! The Orange line is the sum of the two hot legs (purple and blue).
Mr Flanagan: “I object! Two customers does not equate to multiple customers.”
Well, customers is plural, so is a plurality of customers ok?
Wait! Mr F, what are you doing objecting all over the place in here? This is just a virtual presentation, not a trial.
Mr Flanagan: “Oh. Ah Sorry!? Yeah, I’m just a bit overwound from a 2 hour virtual lecture on the complete history of honest lawyering.”
Sounds a bit too long!
Speaking of too long, let’s move right along. Mr F keep up with the rest of the crew.
Discovery Party #1 comments “that the side bar is not consistently the same, so the usage graph can be deceiving.” The following 2 examples show that the “side bar” values, being different, can be misleading. In this case, the 26th seems “more active” than the 25th even though there is only a 1 kWh difference.
Figure 7-3. Example showing sidebar range of 0 kWh to 4 kWh. The vertical scale is twice that of the 26th, and thus appears “flatter” as the slopes are “halved”.
If one was to look at only one day, then the issue is mute. The issue is relevant when comparing multiple days, as one often does.
Figure 7-4. Example showing sidebar range of 0 kWh to 2 kWh. On the 26th, the vertical scale is half that compared to the 25th, and thus the slopes are steeper, ie doubled.
When comparing multiple days, then the vertical scale should be the same. But don’t take our word for it, go and ask some mathy people. Answered.
Mr Flanagan: “Wouldn’t that be a design enhancement?”
What design? Were you in Florida all this time? Never mind, let’s keep going…
Thank you Discovery Party #1.
Discovery Party #2
In an ‘Opinion’ letter, to the Penobscot Bay Pilot news organization and published on Wed, 02/14/2018 – 2:30pm, we have a CMP customer that has had a frustrating experience with CMP trying to reconcile her bill and/or energy usage from one year to another and/or one month to another. I sympathize with her frustration, as CMP should have knowledgeable people to answer her type of concerns.
Over two and a half years ago!
Yup, that’s pretty much the time frame I gave up on using Usage Alerts and Energy Manager.
But anyways, continuing…
She had prior bills and current bills. She had Usage Alerts, and a snap shot of her meter. She had a list of appliances replaced and when. Sounds like a lot of work was done to make her home more energy efficient.
She mentioned that she replaced her old hot water heater with a hybrid geothermal heat pump heater. I have one of those operating in hybrid mode. I can see when it uses the heat pump, and I can see when it activates one or both electric heater elements. The efficiency of these type of heaters depends on where they are installed. Lots of variables.
So what’s the problem?
CMP is the problem.
Mr Flanagan: “Well, perhaps if you were a bit more vocal back when you discovered the problems yourself, then you would have saved all those customers a bunch of frustration. Kinda share the blam…”
Stop right there Mr F, I thought of that. Corporate America just doesn’t listen to the little guy – they’d rather pay a bunch a yahoos to inhale and exhale out some smoke. Yeah, so no guilt here.
So let’s help Discovery Party #2, shall we?
Her January bill has a meter reading date of January 10th, and a reading value of 9047 kWh. She has a Usage Alert from some time on January 25th showing date range 1/10-1/24 with total usage of 895 kWh. She proceeds to reconcile by taking the value of her meter, 9853, and subtracting the bill reading value, 9047. Her value computed is 9853 – 9047 equaling 806 kWh.
There is no way 895 and 806 are closely the same number in this universe, so it is natural to question such things.
If we take 895 and divide it by the number of days from 1/10 to 1/24 we get 895/15 equaling 59.66666667 average kWh per day. We’ll just make it 60 kWh for ease of use.
January 10th should not be on her usage alert because that date is really the last day on her January bill!
So let’s subtract the 60 for that day from the 895. We now get 835 for 1/11 through 1/24.
895 and 835 are still not the same. What else can we check?
Continuing, one plausible answer is that the meter reading from her photo is from 1/24, say noon, and therefore her meter is lagging that of the Usage Alert because the Usage Alert records up through midnight (11:59:59.9999 PM) of the 24th. Because she is averaging 60 kilowatt hours per day, it’s possible that the remaining electrical usage from noon to midnight on the 24th might make up the difference.
If the date and time of the photo were known, then it would be possible to be more concrete in this plausible explanation. She took photos of her meter over a 4 day period and compared the meter/bill delta value to that of the Usage alert message.
And, CMP should have been able to relate this type of information, instead of simply testing her meter and proclaiming everything was just fine.
This is a reasonable explanation per my experiences and exhibits shown herein in this multi-part study.
Because the meter display represents a moving value, and the Usage Alerts and Energy Manager are snapshot aggregates about 1 or 2 days old usually, this reconcile/comparison process is not always easy. But it should be for CMP, and for CMP to assist its customers. Really.
Bottom line…unfixed CMP problems resulting in customer frustration.
Thank you Discovery Party #2.
Yes, Mr F?
Mr Flanagan: “Oh, seems like she would be happy with everything by now though.”
LOL, Mr F. I doubt it. It’s still broken today in my experience noted herein some 2.5+ years later. Same problem then, same today.
Mr Flanagan: “Maybe some of them retired folks took it with them. That and the big storms and the Pandemic thing.”
I see Mr F that you’re thinking how CMP might reply. I just might have to put you on mute.
Moving right along…
Discovery Party #3
I read what I believe to be is a Maine PUC exhibit relating to the CMP Billing Issues from a so-called energy expert from some where. The person claimed to be familiar with the energy consumption of a plethora of energy consuming devices. With that knowledge he could not explain his energy consumption during the early early AM hours and therefore his bill was called into question.
I believe his described issue to be “filler” values as such noted via other exhibits herein. Of course, this is only speculative.
Mr Flanagan: “Well that seems a bit thin.”
Yeah, but shouldn’t an energy expert have his own nerdy real-time monitoring system? If not, it’s like being an aviation expert but never having flown. Or, it’s like being a physics expert and not knowing Einstein’s birthdate. It’s like being a dairy farmer but milking someone else’s cows. It’s like being a doctor who graduated with a D+ average. And finally, it’s like an oak tree without …. nevermind.
So…
Thank you Discovery Party #3
Discovery Party #4
Also having read the CMP Billing audits by LAWYERS&LAWYERS, etc.
My conclusion is that lawyers, consultants, and doctors seldom have a sense of humor, but they sure do know how to itemize.
Failure to follow industry standard practices. Now that’s a catchy phrase. There are a lot of smart people that got pissed off from that I bet. Lawyers do that kind of thing – piss off people. Forbid even stepping outside the sandbox boundaries in a report.
Yeah, said report was more about billing, but I’d thought I’d mention that I read some of that stuff. I’ll probably forget about it by tomorrow.
Oh Well, thank you Discovery Party #4
Mr Flanagan: “Whoa, did I fall asleep or what?”
No, Mr F, not at all. Just mentioning that CMP corporate management needs a new visionary.
Mr Flanagan: “I see. Do you have a POC?”
Not yet, but for now, let’s take a breather and reconvene 0900 on some day in the not too distant future.
Hold one sec…I forgot to summarize…
We have now seen other parties, other than the author, who have directly or indirectly corroborated the previously aforementioned and possibly subsequent problems and issues in this multipart pandemic of a blog thing.
CMP now has an outbreak. According to Dr Shahski-N-Hutch, if there are 3 or more problems at one location, then that is classified as an outbreak and the bugs tested positive need to be isolated, quarantined, and fixed.
Previously I laid out a few Usage Alert screens and some problems currently existing therein. Let’s move on and show some poor examples of graphs in Energy Manger ‘Energy Use’ detail screen.
Mr Flanagan: “About time!”
How so?
Mr Flanagan: “Well, it seems you’re being more positive than usual.”
Just setting bait, Mr F, just setting bait.
Mr Flanagan: “I don’t know about the rest of the virtual class, but I’m taking notes.”
Great, or you could just download the PDF.
Let’s get today’s show on the road and see if we can get outta this place before the weekend. Probably the last thing I’ll ever do. And, don’t let me be understood on that. Animals.
Proceeding right away…
The “House of the Rising Sun or Solar Power at Night” problem graphs
Figure 1. Solar Panels? Nope. Sun still up? Nope. Am I putting power on the CMP grid? Nope.
The “All in one Hour” or the “Almost All in one Hour” problem graphs
Figure 2. Look! All the energy is used in only one hour of the day! Nothing else used all day, and I was home socially distant.Figure 3. Look! Almost all the day’s energy used in the last hour of the day. Phfffft!
The graph has values: 0.73, 0.45, 0.37, 0.40, 0.38, 0.36, 0.64, 1.22, 1.26, 1.46, 1.00, 0.72, 0.70, 0.40, 0.59, 0.58, 050, 0.58, 0.98, 1.01, 0.62, 0.48, 0.50, 5.87. Added up = 21.8 kWh; rounded (up) = 22 kWh. What an amazing coincidence.
But…the real values for each hour are: 0.745, 0.446, 0.466, 0.464, 0.468, 0.505, 1.003, 2.04, 2.139, 0.979, 1.066, 0.895, 1.018, 0.904, 0.725, 0.74, 0.632, 0.639, 0.923, 1.125, 1.36, 1.117, 0.909, 0.838. On the graph they would be rounded, as such: 0.75, 0.45, 0.47, 0.46, 0.47, 0.51, 1.00, 2.04, 2.14, 0.98, 1.07, 0.90, 1.02, 0.90, 0.73, 0.74, 0.63, 0.64, 0.92, 1.13, 1.36, 1.12, 0.91, 0.84. Added up = 22.18 kWh; and rounded (down) = 22 kWH. 22 kWh is what the graph got correct! Do you see it up there in the corner? Kinda makes you wonder how the CMP systems store the data for all this. The cloud? Yeah the cloud is all the rage. More like the fog bank though.
The “Let’s show the same Kilowatt hour for all 24 hours in the day” problem graphs
Figure 4. I did a great job keeping all my appliances using the same electricity all day! Not.Figure 5. Go figure I can run my house this flat! Not.Figure 6. Flat line energy use at 1.75 kWh. Shouldn’t be.
Oh, and there are about 8 more of these type of days, ie flat-liners, that I’ve come across in my usage data via Energy Manager!
The unexplained problem graphs
Really, they are all unexplained, but let me just pick on one of them – and that would be Figure 3 above. I don’t have an explanation, and that’s my explanation.
Yes, Mr F?
Mr Flanagan: “Yeah, those are some really messed up numbers. I can’t decide which is right and which is an illusion anymore.”
Understood!
Mr Flanagan: “So can we make all those numbers a little easier to read for everybody? Especially Figure 3. Like maybe in a spreadsheet table?”
Probably.
Mr Flanagan: “Well at least let us know how you know what the real numbers are. I followed your link, from Part 5, to your own energy manager system that you have hooked up at your house, and even that small “CMP versus you” comparison graph had some deltas for the usage data. So how do you know what values are right for CMPs own systems?”
Now that’s a ramble Mr F.
Remember I said there was another way? All the way back to about half way into part 4? Well that “another way” will be explained in Part 8 of this series. Meanwhile in part 7, we’re gonna take a side journey to add to our misery. So rest up your eyeballs and fluff up your aching seater packs.
So here we are class, and what we know is that Central Maine Power’s Usage Alerts and Energy Manager applications have problems. The overall view in this author’s mind is that CMP can do some relatively simple fixes. Maybe.
Now, in this study, we have looked at one CMP customer’s data. Mine. It is likely that the aggregate kWh values are based on a full day, meaning that the data presented for a date is for the full 24 hours from midnight to 11:59:59 PM. Therefore we should never see “shared” dates across two bill cycles like we have seen in this series. Whereas the author is a long-term year-round customer with one meter and one location, I can’t speak for those cases that are different, and that is where the experts come in. Doesn’t it seem like CMP took a lot of things for granted? Probably outsourced the wrong math position.
I know that I am a unique individual, but this problem is unlikely unique to me.
And for the record, here are weeks 3 and 4 Usage Alerts, straight from my phone. Again they have the wrong start date for the upcoming bill cycle. It should be 8/26 instead of 8/25. Imagine if you will, if I wanted to know how many days were in the month of September, and someone said 31 because they included August 31st! And to recap, the value of 15.6, for 8/25, should not be added, and thus the Usage total is wrong on the Alerts.
Anyway…
and
And the same issues that we have already seen before with Energy Manager continue as well. Or rather not so well.
My actual bill is likely to get generated before the next Usage Alert, so I won’t be receiving a 5th alert for this month. The next weekly alert will be for a new billing period. At least that’s the way it has worked for me.
So you can probably have guessed by now that I don’t use the Usage Alerts that I’ve signed up for. And here’s the bottom line: can’t trust it at the moment.
Here’s the Usage Alert message options and my comments
A weekly message with usage, cost, and average information. Right, we talked about this one throughout this presentation. We didn’t talk about real time and on time, but I’ll just mention it. Just did.
An amount exceeded message. You can put in an amount like 1500Kw, and you’ll get a message only if you exceed that amount in the current billing cycle. Some folks might find this useful, but I’d rather know if I have a daily jump past an amount exceeded. So if I put in 60 kWh and the smart meter day value exceeds that amount, then send me an alert. Get it? In real time, not a day or so later.
A daily usage change message. If your daily usage changes by 50% higher or 75% lower for three consecutive days as compared to your past 30-day average, then you get a message alert. What does this even mean to the average customer? Hey your usage is way up, go see if that heater in the hen house is on high. I know what CMP is trying to do, it’s just not well executed. Plus it’s not real time. I have yet to get one of these Alerts, which tells me I’m not in control and thus why I’d prefer to use #2 as I describe.
Simply text USAGE to the number cited, and you get a Usage Alert reply with usage, cost, and average information. The problems are same as number 1, except you control when you get the message by simply requesting it. Again not real time. For example, if I request USAGE today 9/24 at 5 PM, then the returned energy information is only current to 9/23 – or about 17 hours of data not included, etc.
Did anyone even ask the customer base what they would want? Nah.
Smart meters are not SMART unless the data is retrievable by the customer as the measurements occur, ie real time. Real SMART meters can do this, but not those so-called from CMP. That $96 million stimulus grant should have made real-time reporting possible for those who would want it.
Yeah, so briefly, due to these problems and more, I have my own “smart” metering system attached to my main electrical panel. A ramble about that can be found here.
Oh, I thought everybody left. Yes, Mr F?
Mr Flanagan: “Yeah, kinda was wondering what you mean by ramble.”
Ramble, as in randomly talking about some topic that pops into my head, and occasionally rambling on and on and on until you get it, but not really expecting anyone to check it out unless they feel like it and have nothing else to do most of the time even on Friday afternoons during a pandemic. See?
Mr Flanagan: “So what are we suppose to do with this information?”
Excellent question, and the answer is: “Is your busted hammer really broken?”
Mr Flanagan: “What does that mean?”
I’m not sure, check back in a few days so that I can make something up.
Hey hey hey Class! It’s been a few days of rest with no homework, other than possibly taking the time to ponder the issues noted previously and forthcoming herein. Like that’s gonna ever happen.
Ah ha! I see Mr Flanagan is rearing to go! What’s up?
Mr Flanagan: “I was just wondering if you’ll be discussing what to do about this hideous trajectory of errors?”
Yeah, probably not gonna go there here. We’ll leave all that to those who want to please the CMP shareholders. I’m pretty sure they don’t want to foot the bill. The CMP distribution rights in Maine pretty much guarantee them a profit no matter what and the PUC is just a big fig newton of us customers’ imaginations. But I re-digress again. Oh, and I’m not going to mention that $96 million smart meter federal stimulus grant that CMP received.
Your hand still up there, Mr Flanagan?
Mr Flanagan: “Ah, yes. You alluded to a special guest in the previous session. Was that just in passing, or for real?”
Hmmm. Yes, it was just in passing. No, of course it’s real. And for the record I said “surprise guest”. Geesh, this COVID-19 crap has got us all on edge. Let’s just take a breather and relax. Pretend for a minute you’re all working in a library indexing old maps. Nah, let’s just go over to Joe’s Bar-N-Bar and socially distance arm wrestle the debate team.
Ok, back. Yeah, the not-really-surprising guest anymore is none other than Mr CMP Energy Manager Energy Use data, graph, thingy. So without further ado, let’s just jump head-on into this perilous tragedy and cook ourselves into the soul of the beast. Shall we?
Bah dah bing, bah dah boom:
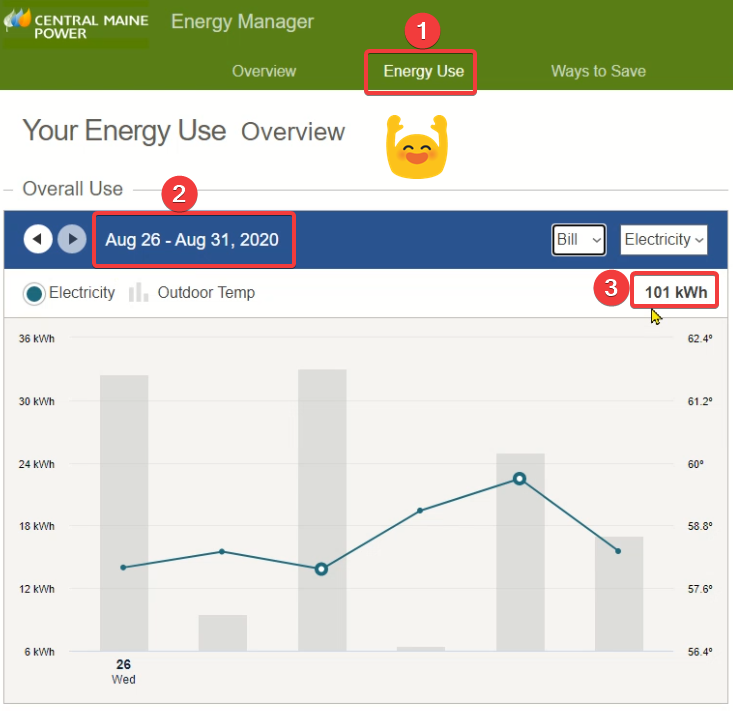
This screen snippet is from the CMP Energy Manager Energy Use screen. When first entering this screen, the graph shows the Overall use for the YEAR.
The Date range for the graph. The graph is changed to the BILL cycle view by selecting ‘Bill’ in the Drop Down selection box (just above the number 3). By selecting Bill after the YEAR data is displayed, the current bill cycle is displayed. Here, it is correct 8/26 thru 8/31.
The kWh consumed for the displayed Bill Cycle, in this case the correct value 101 kWh.
Yahoo! The date range and the kWh value are both correct!
So, it looks like we have a winner in the Energy Use menu item.
Then again maybe not.
Yes, Mr Flanagan?
Mr Flanagan: “Gee, seems like every time you tell us things are great, that there’s always a maybe. What is going on here?”
Well Mr F, I had a dream. Strike that. I heard there’s an opening at CMP in customer relations to replace the invisible guy that was modeled after the Home Depot founders plan. Ah strike that, we all know CMP would not intentionally have a fictitious executive to deal with customer backlash. But I digress. Hmmm, perhaps that’s why my “Contact Us” e-mails went nowhere.
Mr Flanagan: “I could do it!”
Do what?
Mr Flanagan: “PR jobs and stuff.”
Oh, ok! Good luck with that. Moving right along…
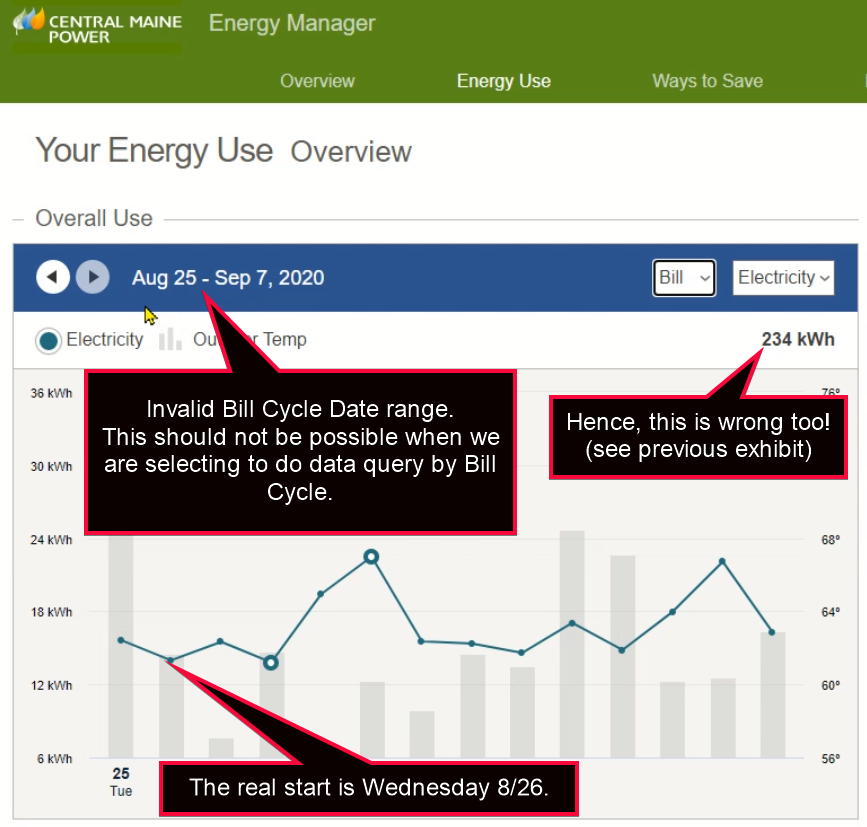
So yeah, the big maybe not in the Energy Use screen goes like this… upon entering the screen and seeing graph with YEAR detail, select ‘Bill’. When BILL graph is displayed, select the left arrow to navigate to the previous Bill Cycle. Yay, it shows July 25th through August 25th. Wow look how cold it was on August 24th!
Alas, the output is correct! (I should note that this series is not validating the temperature values, right or wrong, as seen on Energy Manager graphs. It is assumed that the smart meters have a built in temperature sensor, and retrieving and aggregating that value is part of the meter reading and uphill processing applications.)
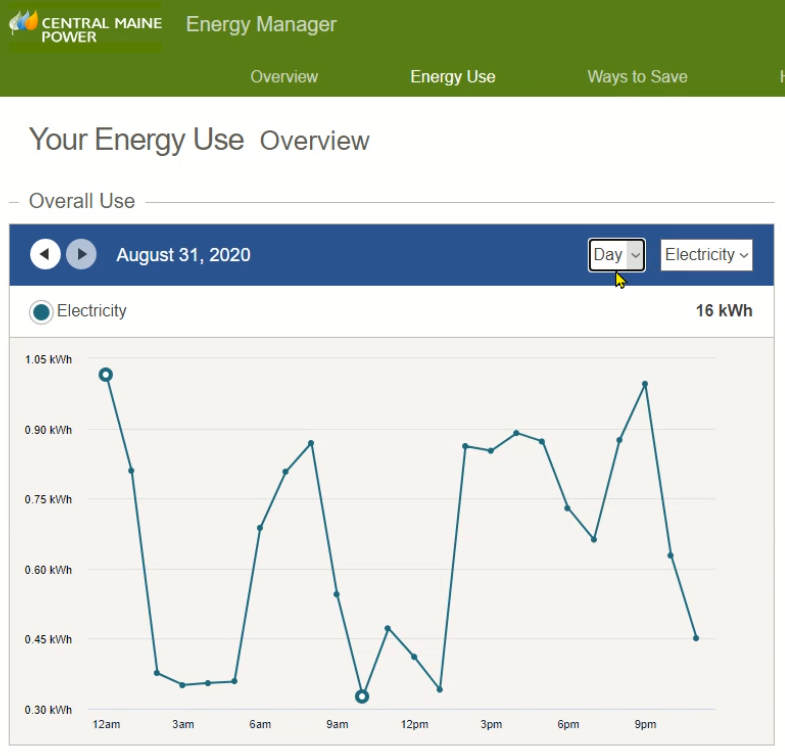
From the above graph, we then, select ‘Day’ from the drop down selector box.
Yay, it shows the correct data for August 31st.
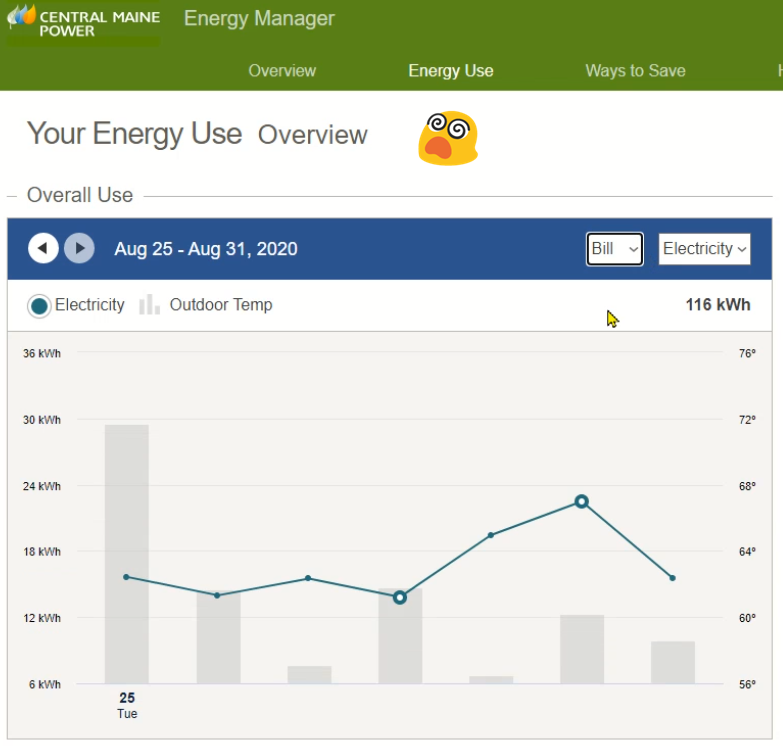
Oh, we forgot to look at that Bill Cycle data a little more thorough, so let’s go back there. Select ‘Bill’ from the drop down selector box. And, wait for it…
Not good.
Mr Flanagan: “Damn it Mr P., my ears are smoking furious. There’s that darn bad start date of 8/25 and the wrong kWh value 116, just like you told us all those years ago. I’m simply flabberpusted at another nuisance. I probably can fix all that myself in 15 or 20 minutes with nothing but a busted hammer and some rusty nails.”
Now now Mr F, let’s be practical, no need to dig that hole under the big W all by yourself (yes, it is A Mad, Mad, Mad, Mad World). And…
There is another.
Mr Flanagan: “Yoda?”
Another way. There is another way, Mr F.
But hey look at the time, let’s call it a wrap and pick this up when, well, when I feel like it.
Looks like I feel like it already, so here we go…
Fast forward some clock ticks in electronica land.
Another week has past and I’ve received new usage alerts in e-mail and text dated 09/08/2020 at 6:23 PM. They both have the same problem as mentioned previously but for simplicity, I’m only including the latest text captured from my cell phone. Take my word for it, the e-mail is similarly wrong.
See the bad? The beginning date is wrong. The kWh value is wrong. This isn’t anything new as we’ve already discussed this. To this end, the process of sending Usage Alerts does not appear to be “self-correcting” during the ongoing billing cycle, other than the end date seems to be adjusting according to the day before the message date/time stamp.
Mr Flanagan: “Darn it!”
Yeah. And here are the applicable Energy Manager screens:
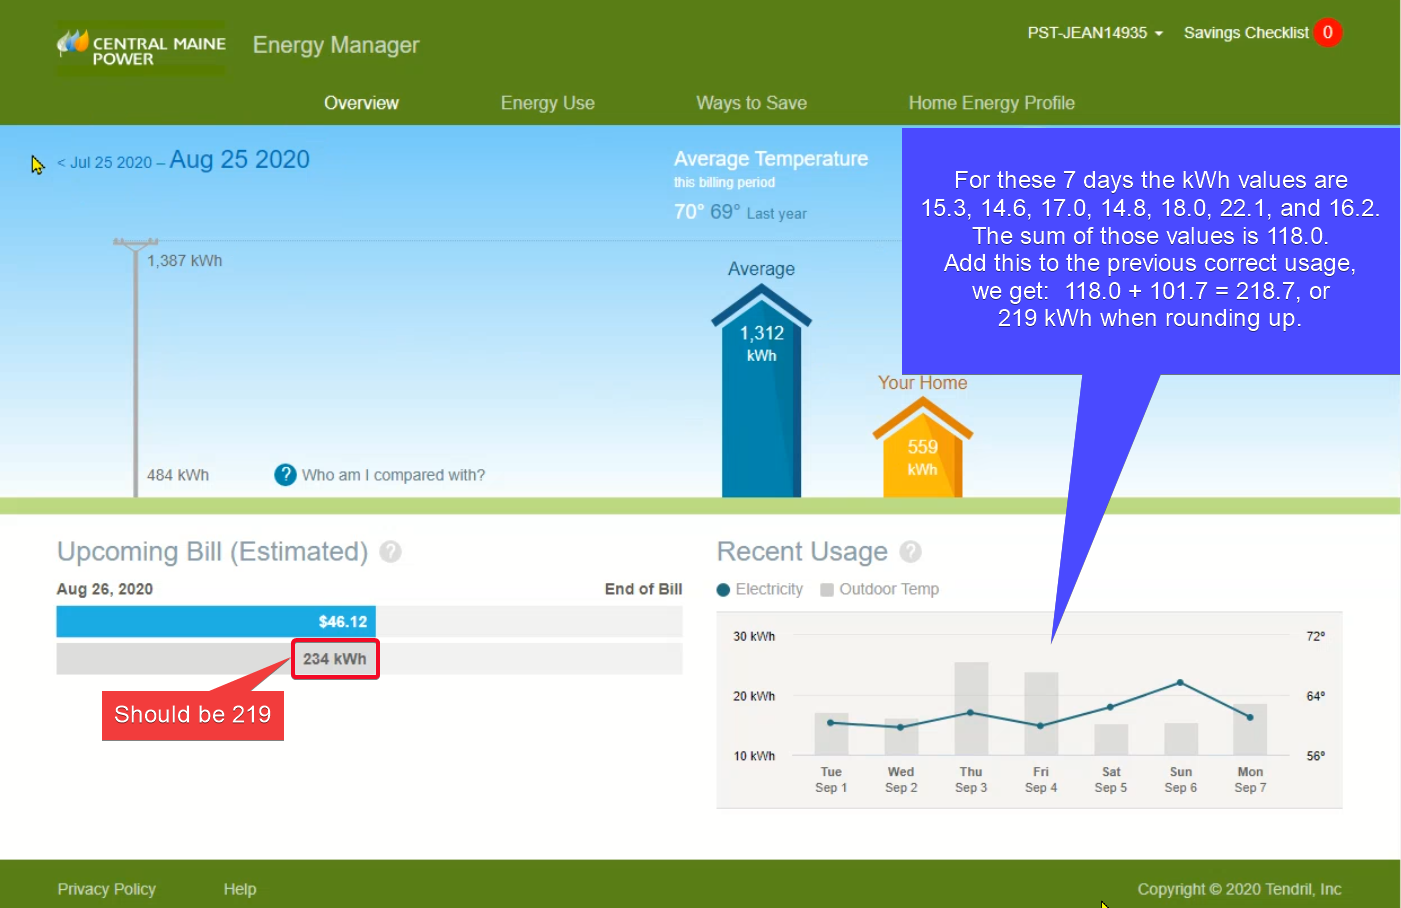
So we see the same problems as before – this screen is adding the value 15.6 from the 8/25 date. Since it should not be adding it, the value is really 219 kWh, as we’ll see in the next exhibit.
We like this…
Mr Flanagan: “Nice!”
Hold on Mr Flanagan.
But, we don’t like this (again previously discussed for my first week’s Usage Alert during the upcoming bill cycle. This screen capture results from simply navigating within the application. It was right, then it was wrong. And it can correct itself by navigating backwards then forwards. Then get wrong all over again. Confusing, am I right? And this happens when viewing cost too, etc.)…
Mr Flanagan: “Uuuughh! I need to de-stressify from all this.”
Yeah, I’m flat out semi-exhausted now myself. I’m gonna go shoot 13 dozen practice bolts at 20 smart meters. I mean yards. Yes, 20 yards. The rest of you can go yell at something inanimate. Keep it peaceful, no rioting.
Class dismissed.
(Note: Click here to go to Part 5 of this Series.)
Hello there! We’ve been discussing CMP Usage Alerts over the past two parts of this series, and I threw in a curve ball in there at the end of part 2 by diving into another CMP system called Energy Manager. And I assigned “the big picture” homework to review the Energy Manager “Home” page. You didn’t know about Energy Manager? Well, I’m telling you me that it is awesome, almost awesome, could be awesome, maybe awesome, or not yet awesome. Really.
Energy Manager is the place you outta be, so they packed up their bags and moved to CMP, CMP’s website that is, CMP’s website to review your energy usage. Hillbillies.
Well the Energy Manager has dates, costs, usage data, graphs, and other shit stuff like that. Yeah, so if you want to monitor your usage, and leave out the alerts, then you can just visit the Energy Manager application. But for us here, we’re talking about both. And you know what? They should be “equal”. That is equal in the sense that the data on both should be able to be reconciled to be equal. Something like that. Hold that thought, let’s review the last screen shot from part 2. Here it is again for those who didn’t review it.
Just like before, let’s quickly go through the numbered circles.
Energy Manager has four Menu Selections: Overview, Energy Usage, Ways to Save, and Home Energy Profile. Here we are on the Overview page.
The most recent billed billing cycle date range is shown here. And you can navigate to prior billed cycles as well.
The upcoming/current/ongoing billing data is shown here. When the end date is reached, a new bill cycle starts.
The last seven days of most recent usage data is shown here. Recall that in part 2, I showed 7 snippets for 8/25 through 8/31. This block is where those snippets were captured from (I hovered over each dot on the line graph for the kilowatt-hour value to display for each date on the snippets). The author does not dispute the values in section 4 for the dates shown. The values for the applicable date range are noted here again: (15.6, 14.0, 15.5, 13.8, 19.4, 22.5, 15.5). What is disputed is how they are used, as we shall see.
Energy Use shows Usage Data in more detail, including by year, billing cycle, and specific day. You can also get the same detail for Energy Cost. We’ll see that later as a surprise guest.
The other piece of info on the web page shows two house figures that compares you to the supposed average household. You don’t win any prizes for doing “better” than average, so we’ll just stick to our own data.
Ah, looks like someone in the back row has there hand up. Yeah, Mr. Flanagan, what’s up?
Mr Flanagan: “Per number 2 on the Overview page, I see that your last billing statement would be for July 25th through August 25th. Did you receive it? And, if so, were you happy with it?”
Well, funny you should bring that up. Yes I did receive my bill a few days ago, and as a matter of fact it was for July 25 through August 25.
It was under a hundred bucks. That is like only the second time in 30 years that I’ve had a bill that low. But we’re not talking about the bills as that has been covered by other people who are geniuses. However, Mr Flanagan you’ve hooked onto something, let’s see what that is. Too bad nobody read the “contact us” e-mails I sent over the years telling them about this. I feel so … nothing. Don’t feel anything at all.
Yeah, so ATM I don’t care how I did, I care how I’m doing. So let’s see what our estimated upcoming bill is. Ok, so it says that my upcoming bill is gonna be approximately $29.50 for 116kWh. Whoa Orville, can’t lift off yet, Wilbur still has an anchor hook in the sand at Kill Devil Hills. Wright?
Yes, Mr Flanagan?
Mr Flanagan: “Per number 3 on the Overview page, I see that the upcoming start date is 8/26 and the kWh is 116.”
And?
Mr Flanagan: “And, hmmm, and, oh, oh, oh, ahhh, I thought you said it was 8/25 and 117kWh. I’m thinking communication is the key to fixing things.”
Thanks for your input Mr Flanagan, you could have a bright future ahead of you.
Now Mr F is right! Seems the Usage Alert really should be telling me the usage as of 8/26 to match what Energy Manager is saying. Or is Energy Manager wrong? Yes. Both. I have my bill in hand for 7/25 through 8/25 so I know the upcoming bill is going to be based on 8/26.
Score 1 for Energy Manager here and a big goose egg for Usage Alerts.
Now, 116? If you recall earlier the summed usage was 116.3. Seems rational to round down, a la .5, here and use 116. But which one is right ? 116 or 117? Both are wrong.
Score goose eggs for both Energy Manager and Usage Alerts.
Yes, Mr Flanagan?
Mr Flanagan: “You’re never gonna please everyone all the time. Some people will complain until their dying breath. But, are you happy with your bill though?”
Ah, Mr Flanagan…. Anything else?
Mr Flanagan: “Sure, wouldn’t it be incorrect to add the kilowatt-hour value of 15.6 for 8/25 to the upcoming estimated total then?”
Well, well, well Mr F, you might just raise that D+ grade up a bit. And yes, that is absolutely correct. 15.6 should not be added because that value is from the last day, 8/25, of the previous bill. The total would then be 100.7, or 101 by either rounding method. So what we have here are at least two systems that don’t support each other. And I’m only talking about the measurement data.
So remember I said to hold that thought a while back? About Usage Alerts and Energy Manager should be “equal”. Well unhold that thought and think now. They’re not “equal”. What good is either system if even the smallest amount is wrong? How can we have confidence that the data we receive in either case is accurate? Kinda makes Stevie wonder.
Yes, Mr Flanagan?
Mr Flanagan: “So the bills are ok?”
Never said that.
(Note: Click here to go to Part 4 of this Series.)
Good morning virtual students! Did you all study that homework? What? No? I tell you I never get no respect. I’ll look past it today as we’re only into the start of the new school year. Remember that. I knew I should have sprung a surprise quiz.
Wake up Phil, it’s just a dream. That was some wild Calculus class – still having dreams getting stuck on the first question of the final. Just kidding, I passed just fine.
So where were we? Oh yeah, Outage Alert e-mail sample. If you can remember from Part 1 of this series, then you will have noticed that the sample contained two highlighted items – specifically “Time period: 08/25 to 08/31” and “Electricity used: 117kWh”. The approximate cost and daily average values are derived from the aforementioned highlighted items, more or less, so we’ll skip those for now, or forever if I don’t get back to them.
Before we continue and discuss the highlighted items, let me show you a sample of the same information that is texted to my smart phone versus the e-mail format. As you can see, the date and time of the text message is the same as the e-mail – 09/01/2020 06:26PM. Both came from Central Maine Power, and you too can have these options when you enroll in FREE Usage Alerts. Heh. Ok, so this message has the same date range, 08/25-08/31, and the same total usage, 117 kWh, both as noted within the e-mail sample given in Part 1. Since the values match between the two, that’s a good thing. Really, it is. But there’s something still sinister under the hood, and it wasn’t even a dark and stormy night. e=mc^2. Oh, by the way, kWh, is short for kilowatt-hour. For those of you with smart watches, you can even have the text show up there. Heck, if you have any of the new smart cars, fridges, TVs, washing machines, crock pots, COVID analysis machines, toasters, faucets, thermostats, switches, golf clubs, vacuum cleaners, elevators, Christmas decorations, and lightning rods, and they have a built-in screen, then you can probably push alerts to those as well. Hmmm. Perhaps going a little off topic there. Sorry Mrs. Lowell.
I once stated I don’t like surprises when it comes to those things that involve math. There are other types of surprises I don’t mind, but that’s not important right now, so don’t bring it up here. For example, I already know that “The Three Stooges” really had 6 Stooges. The good ole days of TV. Hmmmph.
Seriously, let’s get back to being serious. Just like CMP (Central Maine Power) always is. Seriously.
Let me just concede that the date range and the usage values are fine. What? Wait, what is sinister in that? We’ll nothing, unless there is something. And there is.
Let’s look at it in reverse, shall we? So, first 117kWh. Where did that value come from? Well, you’d think it would come from your smart meter. Kinda. It has to start there right? Yup. Starts there and is further aggregated, processed, and stored by who-knows-how-many subsequent computer systems. Perhaps even multiple times. So, 117kWh is correct? Maybe.
Coming right out of left field, CMP also provides their smart meter customers additional free services which provide for 1) Viewing usage data online with CMP’s Energy Manager, and/or 2) Downloading usage data into two formats for external processing within Microsoft Excel for example. I use both of these services, and as you would like to think, the values should match. Oh gosh, I almost forgot…everyone eventually gets a bill, whether they like it or not.
We’ll forgo discussing the downloading service for now, and start with CMP’s Energy Manager service which is available online once you log into your CMP account. So let’s login and check it out. Vroom, fast forward, we’re on the right web page and here is the data for each day 8/25 through 8/31 as seven separate screenshot snippets. Say that 10 times fast – seven separate screenshot snippets,…
There you have it, but yeah it’s a little blurry, so here are the set of values for 8/25 through 8/31: (15.6, 14.0, 15.5, 13.8, 19.4, 22.5, 15.5). Add those up and it comes to 116.3. Yeah, summing wrong, summing right! LOL! 116.3 does not equal 117. Some smart eyed readers might recognize that the value of 117 can be explained as CEILING[116.3]=117. The CEILING function will return the smallest integer value that is greater than or equal to a number. And that’s perfectly fine to do, and I’m ok with that. That is, if everything else was fine in data land. What? Where are you going now? So, yeah, where am I heading? Probably something on the order of “location, location, location.” Or is it “details, details, details”?
Ok, I must confess, those 7 day snippets didn’t show the whole picture! Here is that picture, which again is data applicable to me. This is your homework, so peruse the numbered circles, and we’ll pick up there next time.
In this multi-part series we’ll explore problems with Central Maine Power’s Usage Alert and Energy Manager systems. Enjoy!
Central Maine Power customers with smart meters are able to utilize a CMP provided service called Usage Alerts. This free service is usually described in the monthly CMP Customer Guide newsletter which comes with your bill or online if you have CMP’s online eBill service. Here’s the applicable snippet from the June 2020 Customer Guide. I’ve overlaid a few numbered bubbles so we can jump right into the section “Understand your usage – Try Usage Alerts.”
But first, let’s check out the included picture. Go study it for a few seconds and come back when you’re done.
Great.
Can’t you just imagine that the kids are outside socially distance playing? Tom, the upbeat husband, standing by the patio door, says “Hey Heidi, would you like to go outside and play a dozen games of horseshoes?” Heidi, the pretty wife, says “Ah, naaah, I don’t have my shoes on. Besides, I’m quite relaxed on the sofa honey. I thought I would just mellow down a bit and check out the latest CMP Usage Update Alerts while I sip on a glass of ginger-carrot juice.” Tom replies “Shazam, I understand so rightly. Thank you for being such a great wife, and mom to our 2.3 children. And, I’m feeling ever so chipper since I read the CMP Usage Update Alerts this morning myself.” That’s right, use that imagination. It can happen.
Right, or maybe not. So let’s just get back to those bubble items, shall we?
Ok, so bubble number 1. “If you don’t like surprises, sign up for Usage Alerts!” I don’t like surprises when it involves math, and I have a smart meter, so I signed up. I get a weekly e-mail and text message that tells me how much energy I’ve used since the start of the current billing cycle and the approximate cost at that point. It’ll also show a daily average for that same period, but what can I say, it’s just an average.
Bubble number 2. Seems this person signed up for Usage Alerts a long time ago to check their home and their camp. I don’t have a camp, but I signed up anyway. I don’t even have a garage, but that’s probably not important.
And, finally bubble number 3. This is a list of the four areas which can be used to trigger an alert: One, a weekly message with usage, cost, and average information. Two, an amount exceeded message. You can put in an amount like 1500Kw, and you’ll get a message only if you exceed that amount in the current billing cycle. Three, if your usage changes by 50% higher or 75% lower for three consecutive days as compared to your past 30-day average, then you get a message alert. And four, simply text USAGE to the number cited, and you get a Usage Alert reply with usage, cost, and average information.
Well that about sums it up from my end.
It does?
Well, no. This is part one. In part two, we’ll explore what it doesn’t sum up. But as homework, here is what we’ll start out with next time. It’s a real sample of what you get for a Usage Alert e-mail. In fact it’s mine. We’ll discuss it next time.
Well looky here. Seems I’m in charge of taking care of a dog, some birds, and some fish while my wife and daughters are away for an extended weekend.
Prior to their leaving the other day, my two youngest daughters prepared a schedule for me to feed the animals. At first, they both tried to verbally tell me – at the same time. So I told them to write it down. While one daughter was descriptive in her requests for the dog and fish, my other daughter took the least effort approach, as in, “feed birds”. So I had her write how much and how often. So away that part of the family went.
At first, I just tossed some seed into the birdcage and squirted them with water. It caused quite a commotion in the cage to say the least. On closer inspection I realized there were some “bowls” attached to the inside of the cage for the food and water. Well, that made it much easier. Let’s see, where’s the vacuum cleaner and paper towels?
And the dog. Molly. What can I say about her? She’s a black lab retriever mix rescued from the local dog pound. I don’t have to tell her to come and get the food – she hears it being prepared. Every now and then she tries to eat at the same time as we do, but I am not a fan of that timing. Plus she sounds more like a horse eating than a dog. She’s a smart dog though – she understands me saying “git”, which means “go and find the furthest place from here without going upstairs or outside, and don’t pee or shit indoors ever”. So she does. Good dog. It is not cruel- animals don’t belong around the dinner table.
Ah, now I can rest. Oops the fish. Fortunately, they are all right side up. Reading the instructions, I notice I need to put two large pinches of food into the fish bowl downstairs every other day. And, I need to put four small pinches (one in each corner) into the fish tank upstairs, also every other day. So there you have it, my fish feeding instructions. But wait, what is a pinch and how big is it? So I Goolgle’d it and promptly got a link to some kind of food channel which was preparing fish. They were showing a two finger, a three finger, and a four finger pinch of salt, with each one having progressively more salt than the previous. So I reached four fingers to get a large pinch and I’ll have to say that that is quite a lot for three fish to eat. Then I checked the three finger pinch. Then the two finger pinch. Notta gonna do it. Then I used reason – my hands/fingers are bigger than hers (dainty and that pinkie lift – her’s, not mine, gosh, some people). So I went back to the 2 finger version and dropped that by half and called it good. Two of those and that should be good. Then for the small pinch, I halved my two finger “smidgen” amount and used that. So for all that, the fish are still swimming around. I’m too old for metric, so don’t even go there.
I surmise, there is a one finger smidgen, but not a one finger pinch. Try licking your finger and dipping it in the salt or sugar – yes, you did that as a kid I know; and if you didn’t then you probably missed out on kitchen chores or other forms of punishment.
In a day or so, this will all come to pass, a smidgen and pinch will be forgotten, and life will return to normal as it was. Normal? That’s a whole other dozen posts.
Binoculars! Where are you? Seems I misplaced them the moment I wanted to spot the newest sky phenomenon – comet Neowise. Having not really wanting to get up between 4AM and 5AM to view the comet in the “morning” sky, I decided to wait until the comet was visible in the night sky.
Well, as luck would have it, we’ve been swamped with hazy skies and poor visibility to the northwest horizon. In my case there’s also a substantial treeline to contend with for objects near the horizon, which the comet was exhibiting during the July transition to nighttime observations.
Not to mention that big honking streetlight a couple hundred feet up the road from my house – something the property owner across the street pays for to light up the entrance to his mobile home park. I’ve been wanting to shoot that out for some time to give my field some darkness when we have bonfires. Doesn’t seem quite the same when the light bathes half the field in light at night. Plus the pole is on my side of the street, previously on my property until the State of Maine stole about 1/4 acre for the great Route 9 upgrade. Oh, but I digress, however briefly at that. Where was I? Oh yeah.
It was a dark and not-so stormy night. In fact, the Big Dipper was clearly visible to the West. No, not the ice cream shop, the part of Ursa Major that looks like a giant pot in the sky. The Heavens Above website showed comet Neowise to be in a potentially promising favorable upbeat location for viewing. So I went out back with my compound crossbow and shot a few groundhogs near the shed. No I didn’t shoot any groundhogs, I’m just pulling your leg. Or is it legs? Not quite sure as I age into my sixties. Well anyway, no animals were harmed in the writing of this post.
Ok, so I’m in the back yard using the house to block the street light’s fireball. I looked to the west, and did some quick geometry in my head and determined the comet was below the treeline. Then, out of nowhere, a small dip dip in the treeline presented itself as a target for my crossbow scope. I’m talking about two finger widths wide and three finger widths high with hand at arms length – a rather small opening at that. I took aim, and saw nothing. After I took off the scope caps, I took aim again and voila, whah-la, there it was – Neowise. It was fuzzy with a noticeable tail. Yahoo!
I quickly called for my daughter Cezarie who was searching the sky out front in the blaze of the local supernova streetlight. She came skipping around and said “what!?”. I noticed she had my binoculars. Do you know how much easier it is holding binoculars than it is trying to spot a sky object through the scope of a compound crossbow? Next thing I had my binoculars and Neowise looked so much better. Without any viewing aid, the comet would be easily missed. To the eye, it looked like a hazy something or other, but more like nothing. Probably magnitude 10.
Remember that metal scaffolding from a post a while back? Scaffolding around part of my house. It’s still there. From a very corner of it, climbing to about 12 feet on a aluminum ladder, the comet was actually about two fingers above the treeline. I took it in for a few minutes more. Now I can say I saw the comet.
I’m going to keep my eye out on the weather to see if the next couple days is better. The moon is soon coming out of the new moon phase, and Neowise will be barreling away from earth as well by July 23rd. I might try to take a photo with my phone through my binoculars. I’ll post an update on that. Yeah, I know, I’m not privileged enough to own a telescope and take a decent picture. I just might have to pillage. Maybe a field trip to the pawn shop, or, build my own a-la the Steve “Red Green” Smith show.
Comet Neowise! July 19th 2020. The big show.
Update: Over the next week, Neowise continued to “travel” under the “Big Dipper” with an increasing angle each night that it remained visible – I’d say the 19th was about 19 degrees above the horizon, and increased into the twenties after that.


 same information that is texted to my smart phone versus the e-mail format. As you can see, the date and time of the text message is the same as the e-mail – 09/01/2020 06:26PM. Both came from Central Maine Power, and you too can have these options when you enroll in FREE Usage Alerts. Heh. Ok, so this message has the same date range, 08/25-08/31, and the same total usage, 117 kWh, both as noted within the e-mail sample given in Part 1. Since the values match between the two, that’s a good thing. Really, it is. But there’s something still sinister under the hood, and it wasn’t even a dark and stormy night. e=mc^2. Oh, by the way, kWh, is short for kilowatt-hour. For those of you with smart watches, you can even have the text show up there. Heck, if you have any of the new smart cars, fridges, TVs, washing machines, crock pots, COVID analysis machines, toasters, faucets, thermostats, switches, golf clubs, vacuum cleaners, elevators, Christmas decorations, and lightning rods, and they have a built-in screen, then you can probably push alerts to those as well. Hmmm. Perhaps going a little off topic there. Sorry Mrs. Lowell.


