
Well, this subject is not exactly electrifying unless you like knowing what is consuming the power that your electric utility company says that you are consuming. Not only that but perhaps you want to know when. Some electric companies provide access to a program that let’s one peruse your usage data on-line and fancy graphs and such are often available. Other electric utilities provide access to usage data by means of a download capability and you do your own analysis. Others provide both. My power provider has both capabilities, but the download option is up to two days prior to the current day. That last part frustrates me – I like real-time data. You’ll need to check your electric provider to see what is available to you.
Despite what the power companies provide, there’s a bit of work one must undertake to get somewhere with it. Raw numbers or a so-called “Green-Button” format, which has dwindled in vendor supported applications are often two options provided for the download data. I use Raw number, which actually happens to be a CSV file (comma separated values, one line per measurement). Spreadsheet programs can read the CSV format, for example.
What do I do? I download the data from the utility company and capture that into my own database for analysis. Because I don’t trust them so much, I also have my own energy meter hardware and I use an Open-source program called OpenHAB for viewing currents readings, and charting over time. At the moment of this post, I am posting my data at 1 minute intervals for viewing on my computer.
Here is an example of a minute in time from November 8th, 2018. Again, this is data that I have captured with my own energy monitor at the main circuit panel and wirelessly connected to one of my home computers.
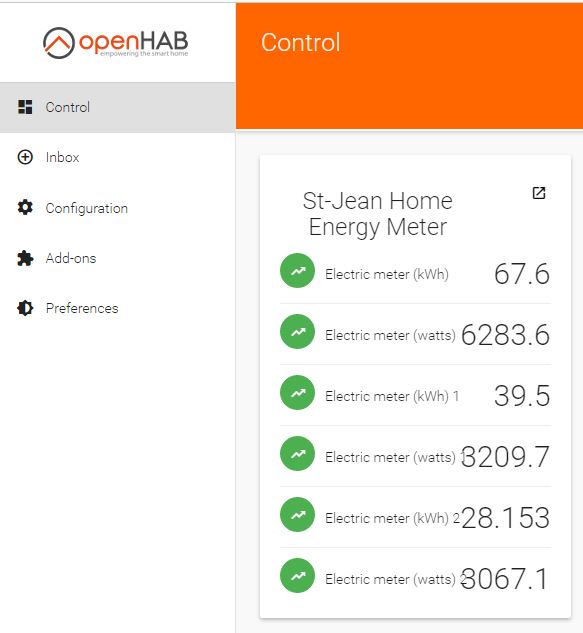
What the heck is that you ask?
Yeah, I know what you mean. Well a few days ago I reset my meter, so since that time, my house has consumed 67.6 kWh (Kilowatt Hours). This number will continue to increment unless I reset it again – it’s basically an incremental counter as you use electricity. The second number is the total watts being consumed at the point in time the sample was taken from the power meter. In my case, the 6283.6 Watts is equal to, or there about, the sum of the two power legs, seen here as 3209.7 Watts and 3067.1 Watts. The next minute these numbers may change completely. For example, my home might just be using 500 Watts.
I know a few things about my electric usage, so here’s some partial info. I have an electric hot water heater (yes, boo you say). It uses about 4500 Watts. When my well pump comes on, I can see it uses about 1200 Watts. I have about 500 Watts residual power being consumed by things that are always on, which we all mostly have – computers, tv, etc. So for 6283.6 Watts, I know that my hot water tank is running, the well pump is running, and that leaves 580 Watts for other things that are happening around the house. The hot water tank is power hungry when the kids take showers. The well runs for a few minutes when it falls to the low pressure point preset.
I really need to get a hot water storage tank running off my boiler. I have one, a commercial superstore with two loops, just need to take the time. I’ll use one loop for the boiler and the other loop will eventually have a solar feed. I digress, but hey, we should all be looking to save money.
And whoa, you asked for it, here’s a graph for part of the same date.
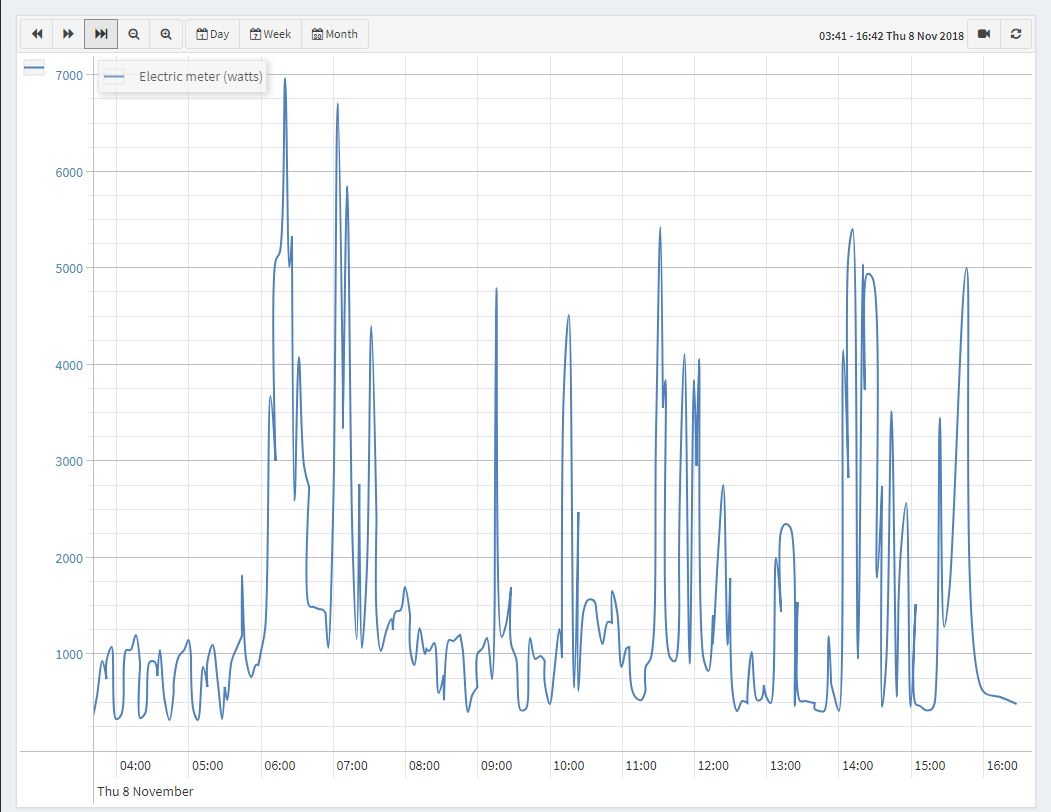
Just a note about this graph. At about 6am, someone has taken about a 20 minute shower – hot water heater on, the well kicks in, and a 600 Watt space heater is still loading the system. Yeah, that’s right, the house is starting to awake. And around 4pm, that space heater that was on overnight has yet to be turned on for the new evening.
And, I bet your thinking the cops and burglars know this too. I bet they could. But then again I own a rifle.